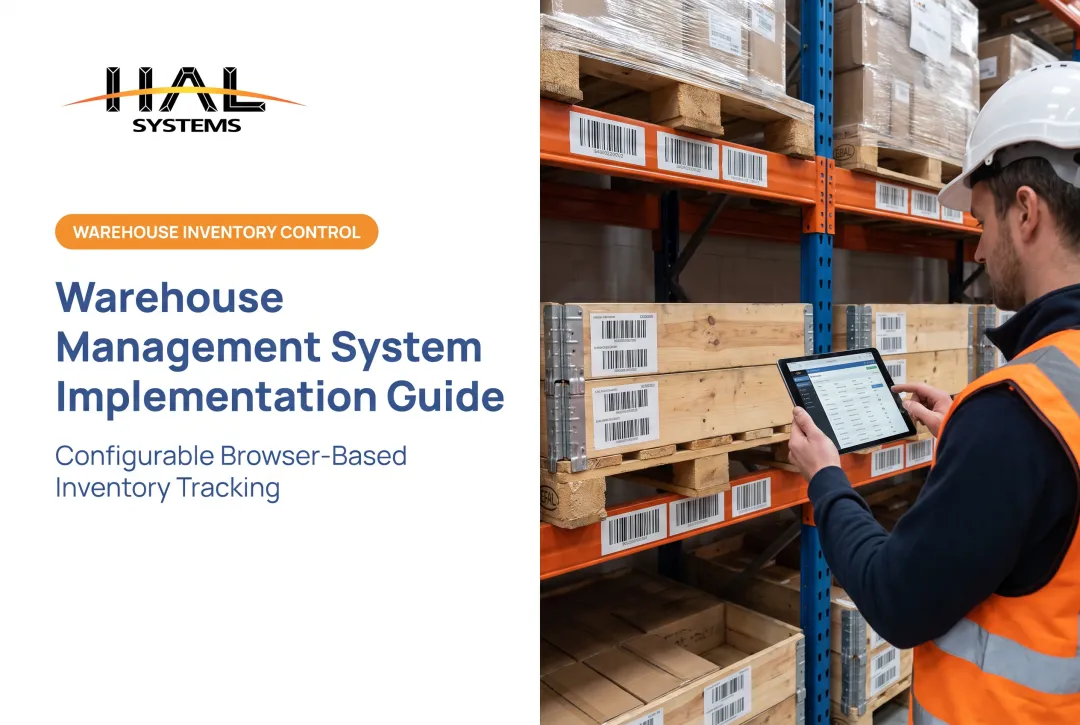

Warehouse reporting converts that activity and inventory data into reports that support daily decisions, performance analysis, and continuous improvement. Done well, it points managers at problems instead of burying them in transactions.
This guide covers the essential report types, five core KPIs, best practices, technology options, and a practical rollout path for distributors, manufacturers, and 3PLs.
Key Takeaways
- Tie every metric to a decision, an owner, a cadence, and a corrective action.
- Accurate source data and shared definitions matter more than report volume.
- Capture data at the point of work with barcodes or system transactions.
- Start with a few reports and expand as your processes grow.
What Is Warehouse Reporting and Why Does It Matter?
Warehouse reporting turns inventory and transaction data into the records and views teams use to run receiving, storage, picking, and shipping. Clear reports reduce guesswork on staffing, replenishment, and exception handling.
Reports, dashboards, and KPIs
These terms get mixed up, so separate them early:
- Report: detailed records, such as every receipt against a purchase order
- Dashboard: a single-page view of selected information for monitoring
- KPI: a measure of performance against a defined objective
Microsoft's Power BI documentation describes dashboards as drawing from one or more underlying reports.
The data behind the reports
Most warehouse reporting draws on a familiar set of fields:
- SKU, quantity, bin or location
- Lot or serial number
- Order status and transaction type
- Timestamp and employee or work group
- Customer and site
If those fields are captured inconsistently, every report built on them inherits the problem.
Decisions reports support
Good reports drive concrete choices:
- When to replenish a pick face
- How to staff tomorrow's shift
- Which orders to pick first
- Which receipts need follow-up with a supplier
- Which locations to cycle count
- Where an inventory discrepancy started
Spreadsheets versus system-generated reports
Spreadsheets work for some small operations. Excel can refresh imported data automatically, so they aren't always stale.
The risks grow with volume:
- Duplicate data entry
- Version control headaches
- Formula errors
- Limited audit trails
System-generated reports update as transactions post and keep a record of who did what.
Types of Warehouse Reports
Inventory and stock status reports
Recorded stock is not sellable stock. Break inventory into on-hand, available, allocated, committed, backordered, damaged, quarantined, and unavailable status by SKU, warehouse, bin, lot, or serial number.
In Dynamics 365, for example, available physical equals physical inventory minus physical reserved.
Related views worth adding:
- Aging and dead stock inform purchasing and markdown decisions
- Reorder and stockout reports tell buyers what to order
- Slow-moving reports help sales push excess
Receiving and putaway reports
Receiving reports compare expected purchase-order quantities with actual receipts. They surface shortages, overages, damage, quality holds, and supplier discrepancies.
Pair them with receiving backlog, dock-to-stock time, putaway status, and location assignment. Dock-to-stock covers the span from arrival to putaway and recording in the inventory system. When it stretches, inventory sits on the dock, unavailable to sell.
Picking, packing, and shipping reports
These reports include picklists, wave or batch activity, picking progress, packing status, orders ready to ship, late orders, backorders, and carrier handoff status.
Managers use them to prioritize urgent orders, assign labor, investigate delays, and compare planned work with completed work. A supervisor who sees 40 orders still unpicked at 2 p.m. with a 4 p.m. carrier cutoff can reassign people immediately.
Space, bin, and capacity reports
Empty-bin, occupied-location, utilization, cube or capacity, and location-activity reports support slotting, replenishment, receiving preparation, and placement of fast movers. Oracle's warehouse documentation, for instance, describes reports of location capacity and percentage fill, including empty locations.
One caveat: capacity reporting only works when location dimensions, status, and inventory movements are captured consistently. Bad bin data produces confident but wrong utilization numbers.
Cycle count, adjustment, and audit reports
Cycle count reports show scheduled, completed, pending, and failed counts, and record variances between system and physical quantities. Pair them with adjustment history, shrinkage or loss indicators, user activity, timestamps, and root-cause categories.
That combination creates a defensible audit trail. A report showing only that a quantity changed tells you nothing. One showing who changed it, when, and why lets you fix the process.
Specialized reports
Manufacturers typically need:
- Raw materials, work-in-process, and component consumption
- Material shortages and work-order status
- Stockroom-to-production movement
3PLs and asset-focused operations typically need:
- Client-separated inventory and location-level visibility
- Check-in/check-out history and equipment status
- Customer-specific service or billing reports
Warehouse KPIs to Track
Five KPIs show up in most warehouses: inventory accuracy, order-picking accuracy, order cycle time, on-time shipment rate, and inventory turnover. Depending on your model, add space, labor, cost, or WIP metrics.

The formulas below follow NetSuite's definitions for the fulfillment measures; define yours explicitly before reporting.
| KPI | Common formula |
|---|---|
| Inventory accuracy | Counted items matching the record ÷ total counted items × 100 |
| Order-picking accuracy | Orders picked and verified accurate ÷ total orders picked × 100 |
| Internal order cycle time | Elapsed days from order placement to shipment ÷ number of orders |
| On-time shipment rate | Orders shipped on time ÷ total orders shipped × 100 |
| Inventory turnover | Cost of goods sold ÷ average inventory |
Define the boundaries
- Accuracy KPIs: State source transactions, counted population, and exception rules. Inventory accuracy counts records; picking accuracy counts orders. Keep discrepancy detail, not only the percentage.
- Cycle time and on-time shipment: Name start and end points, cutoffs, promised dates, partial shipments, and service levels. Internal cycle time ends at shipment; total includes delivery. Fast but incomplete orders are not a win.
- Inventory turnover: Connect it to purchasing, demand, aging, carrying cost, and availability. Skip universal targets; turns vary by product, industry, and replenishment model. WERC's 2026 report covers 36 metrics across industries because peers matter.
Segment so averages don't hide problems
Break each KPI down by warehouse, shift, customer, SKU family, order type, carrier, or period. A 98% overall pick accuracy can conceal one account at 91%.
Give every KPI an owner
Each KPI needs a named owner, reporting cadence, target or internal baseline, exception threshold, and documented action. A metric with no associated decision is usually just a data point.
Warehouse Reporting Best Practices
Start with decisions and audience
Identify who uses each report and what it supports. Executives, supervisors, purchasing, customer service, finance, production, and 3PL clients each need different detail and frequency. Show only the fields needed, and provide drill-down for people who must investigate transactions.
Standardize definitions and ownership
Build a data dictionary with one agreed calculation for terms like available inventory, shipped order, late order, received quantity, inventory accuracy, and perfect order. Assign owners for source data, report logic, approvals, and corrections. Otherwise two departments produce two numbers and nobody trusts either.
Capture data at the point of work
- Use barcode scanning, mobile devices, and RFID where it fits.
- Label locations clearly.
- Enter transactions directly, not later from paper.
- Validate item IDs, locations, units of measure, timestamps, and user IDs at entry.
- Confirm lot or serial data and status changes before they reach reports.
Match cadence to need
Shortages, order queues, receiving backlogs, and exceptions need near-real-time or intraday refreshes. Trends, vendor reviews, and capacity planning work on daily, weekly, or monthly schedules. Document freshness expectations and show the last-refresh time on every report.
Design for exceptions and action
Highlight variances, late activity, stockouts, unusual adjustments, missed cutoffs, and out-of-range performance. Link each alert to an owner, escalation path, root-cause review, and resolution status. Too many alerts train people to ignore all of them. The ISA's alarm management standards address this risk in industrial settings.

Govern and review
- Apply role-based access and separate client or site data.
- Protect sensitive inventory and cost data.
- Maintain audit history and version control, and require approval for formula or filter changes.
- Review reports periodically for adoption, speed, accuracy, and redundancy.
Warehouse Reporting Technology and Tools
A practical stack
For small and mid-sized warehouses, the stack usually looks like this:
- Inventory or warehouse management software as the transaction source
- Barcode or mobile capture at the point of work
- Integrations with ERP, accounting, shipping, and eCommerce systems
- Dashboards or exports for analysis
Comparing approaches
| Criteria | Spreadsheets | Built-in WMS reports | Connected BI tools |
|---|---|---|---|
| Setup effort | Low | Moderate | Higher |
| Timeliness | Depends on refresh | Updates with transactions | Depends on data feeds |
| Customization | High, manual | Limited to configured reports | High |
| Auditability | Weak | Strong | Depends on source |
| Best fit | One small site | One site, standard needs | Multiple sites or clients |
One example: HAL Traxx
HAL Systems builds HAL Traxx, configurable software that can serve as a warehouse management, inventory, asset tracking, or work-in-process solution. It provides integrated reports for common needs and SQL Reporting Service for custom reports that access the entire database.
Core capabilities include:
- Barcode, RFID, lookup, or manual entry at the point of work
- Interfaces with ERP, factory automation, shipping, eCommerce, and accounting through APIs, ODBC, or transfer files
- On-premises deployment or hosting on Amazon Web Services
Putting Warehouse Reporting Into Practice
Follow a phased path:
- Identify the highest-impact warehouse decisions.
- Audit the data you already capture.
- Select a small group of reports and KPIs.
- Define owners and terms.
- Test reports against physical counts or source-system records.
- Expand once users act on the first results.

Pilot one workflow
Start with receiving, cycle counting, or order fulfillment, not everything at once. Build the pilot around:
- User training
- Barcode and location-data checks
- Exception handling
- A documented process for correcting bad records
This mirrors the ASQ PDCA cycle: plan a change, test it small, review results, then extend what works.
Effective reporting is a loop. Capture accurate activity, report the right information, investigate exceptions, change the process, and check whether performance improved. Then repeat.
Frequently Asked Questions
What are the 5 KPIs for a warehouse?
Inventory accuracy, order-picking accuracy, order cycle time, on-time shipment rate, and inventory turnover. The best final set depends on your customers, products, and operating model.
What are types of reporting?
Operational (current on-hand and available stock), analytical (performance by site or product), exception (count discrepancies pending review), and audit (adjustment records and material-status history).
Which warehouse reports should a small business track first?
Start with inventory on-hand and availability, receiving, order fulfillment, and cycle counts. Add space, vendor, labor, or cost reports as complexity grows.
How often should warehouse reports be updated?
Fulfillment and exception reports may need intraday updates. Trend, vendor, expense, and strategic reports can run daily, weekly, or monthly, depending on the decision they support.
How can warehouse reporting improve inventory accuracy?
Barcode transactions, location-level records, scheduled cycle counts, and discrepancy reports expose errors. Root-cause analysis then fixes the process behind them, closing the feedback loop.